In this article I want to break down some key concepts about wealth and income distribution utilising concepts from thermodynamics and entropy to show how gamed current economies and societies are and, more importantly, how we can undertake long term policy changes to fix it.
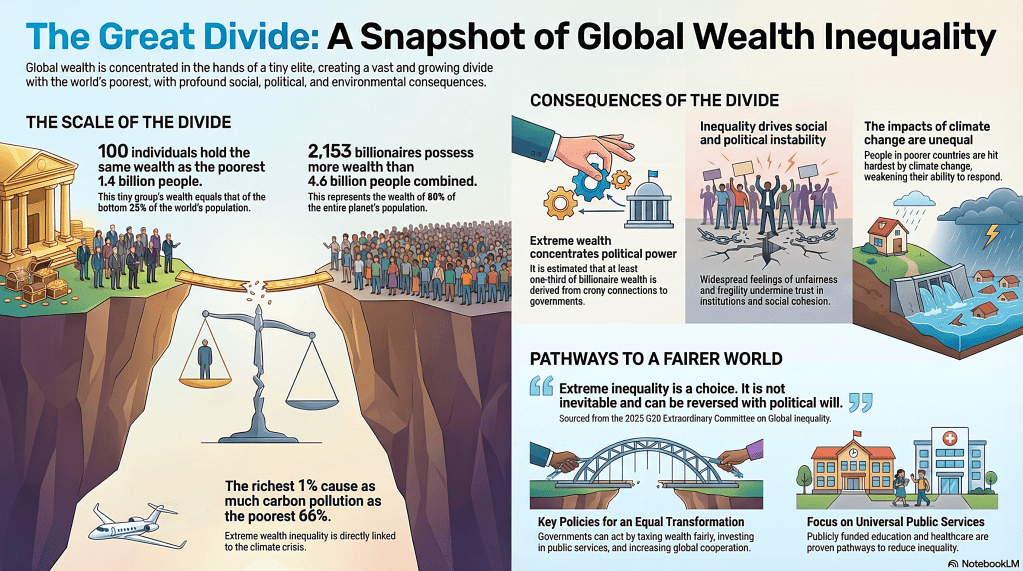
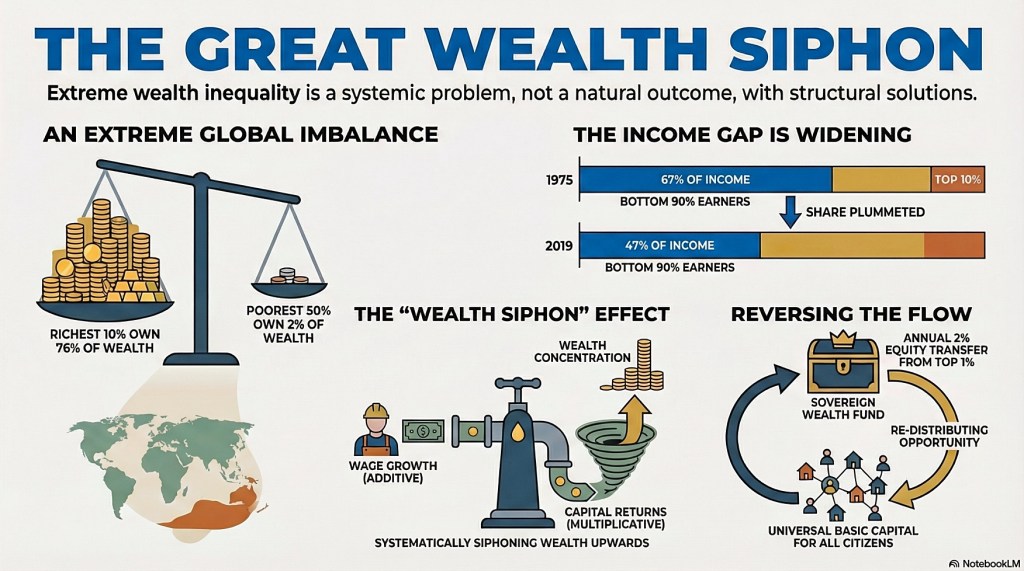
The G20 recently released the Global Inequality Report,1commissioned by the G20 South Africa Presidency in November 2025 and led by Joseph E. Stiglitz. It characterises global inequality as an “emergency” and a “policy choice,” asserting that the negative trends can be reversed. The report finds that 83% of countries globally exhibit high income inequality encompassing 90% of the world’s population. This crisis is primarily driven by wealth concentration, which is far higher than income inequality.
It is intended to be a more practical diagnostic and prognostic essay than some of my more philosophically minded musings. It has three layers:
- descriptive (what the data/models say about distributions)
- diagnostic (why the current regime is unstable/inefficient)
- normative/policy (what could be changed and over what timescale)
It is quite long with quite a bit of technical info, so if anyone just wants the high level policy brief see here: Policy-brief-gini-transition
Alternatively you can listen to the AI podcast:
This article, and the information behind it, has been prepared with significant assistance from AI tools. I am not an economist (more ‘a fumbling philosopher and part-time poet’) and this is not my day job. That said, I hope it encourages policy makers to engage with heterodox professionals to analyse how we can fix the wealth siphon and help billions of people escape the cold box (poverty) trap.
Feel free to use my notebooklm for your own research and to see most of my source material:
https://notebooklm.google.com/notebook/7d0b8799-7367-482a-bbd3-98aba6c8fdee
Some initial caveats:2
- I use econophysics models (Boltzmann‑Gibbs, Pareto tails, entropy‑based indices) as lenses on wealth distributions. These are not literal physical laws for societies, but powerful analogies and mathematical tools to reason about inequality and how we can have greater freedom of action (useful activity).There are several important ways in which the analogy with energetic particles breaks down:3
- When this article refers to ‘Gini 0.50’ as a more natural equilibrium, it means a benchmark implied by exponential/BG‑type wealth models and echoed in some historical periods, not a universal constant.
- The article contains hypotheses about features that are suggested o encourage a more fluid and natural state of a healthy society and economy. Read the suggestions accordingly rather than dismissively.
- It may be that capital ‘naturally’ has a fundamentally different distribution to normal labour income, i.e. the Pareto pattern may not just be based on political and legal capture and preferential tax treatment – even if so, all the more reason for additional controls to manage the compounding concentration risks.4
- Introduction
- The Global Wealth Freeze
- The Cold Box Trap
- Understanding Econophysics
- The Common Critiques
- Measuring Inequality
- Comparative Data On Inequality
- The Equality Engine
- What is Entropy?
- Footnotes:
Introduction
I have previously written a relatively philosophical piece on Inequality & Inequity.
Everyone can see and feel that the current socio-economic system is structured to ensure the vast majority of people remain poor, or become even poorer, and so reduces the amount of energy available to grow our economies, improve people’s everyday lives and encourage diverse economic activity. The relevant concept here is aggregate freedom of action. These inequality patterns are not fixed laws of nature – they emerge from the rules we’ve chosen and can be changed by choosing different rules.
Philosophy, public policy and our democratic institutions must be aimed to help us get out of the box or bottle in which we are trapped.
I refer to lower inequality as a more ‘natural’ distribution of wealth. I am acutely aware that periods of shared prosperity, like the post-WWII era, are often seen as historical anomalies. However, I use the term ‘natural’ here to describe a state of stability and probability—the distribution that would emerge absent a system rigged to enforce an economic master-slave relationship between the few and the many. The historical dominance of such economic enslavement is not a law of physics, they are choices made largely by those that benefit most from such a system but they require our continued consent to function – it is precisely the reason we must break these ‘mind manacles.’
We have built economies that treat everything that matters—including each other—as a commodity. Consequently, our foundational models—GDP, Net Present Value, the Circular Flow—are fundamentally wrong. We have created a world where we devour the biosphere and ignore the existential risk to our own species. This master-slave disease has brought us to the brink of ruin: the hubris of acting as if we can take endless resources from a finite world. These flawed theories of production and accumulation can only lead to collective self-destruction.
No higher power will save us from this arrogance. We must evolve what it means to be human; perhaps then, at last, we will earn our self-chosen name: Homo sapiens (‘Wise Man’).
I am also mindful that nature does not always change gradually; it evolves by punctuated equilibrium. All systems require periods of creative destruction to ensure the perpetuation of life itself.
“The aim of philosophy is to show the fly the way out of the bottle.”
(Wittgenstein)
Here I seek to move from the philosophical foundation, I previously wrote about, to the physics of money, analysing current data and suggesting reforms needed to fix our current system.
The current economic debate is paralysed by a false dichotomy between ‘Capitalist Growth”‘(which encourages extreme inequality) and ‘Communist Equality’ (which encourages a lack of individual freedom and economic stagnation). We need a third more scientific metric: aggregate Freedom of Action. ‘Freedom’ is not merely a negative legal right (the Hobbesian freedom from capture, imprisonment and slavery). It is a positive requirement linked to the concept of thermodynamic energy—the distribution of power to act, innovate, take risks (as well as to refuse coercion).
Recent advances in econophysics help us to understand the nature of our two-class structure in the distribution of income and wealth. This is not a sociological theory but a mathematical (statistical) reality.
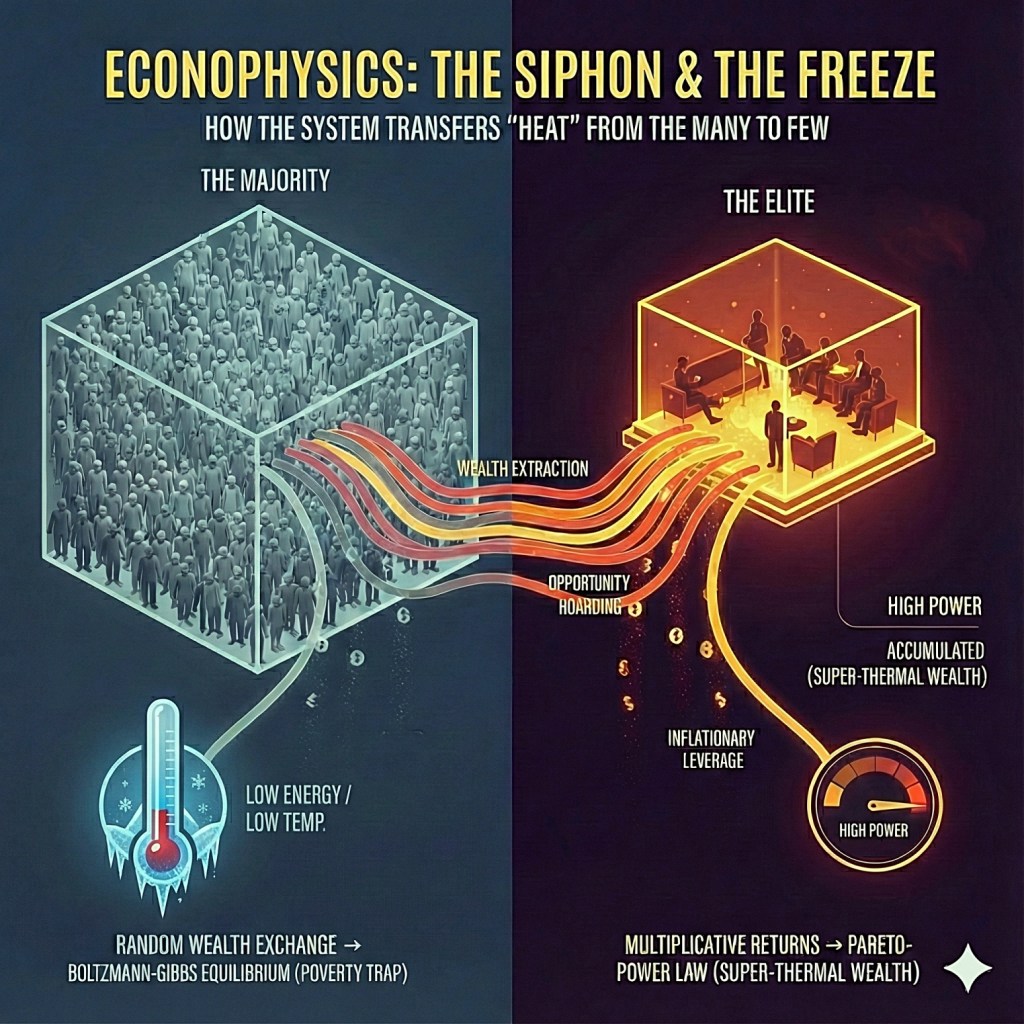
- The “thermal” majority, comprising the bottom 97-98% of the population, has an income distribution that closely follows a Boltzmann-Gibbs (BG) model. This distribution of income resembles the random, additive exchanges of particles in a gas and is characteristic of systems in statistical equilibrium.
- The “super-thermal” elite, consisting of the top 2-3%, sees its wealth and income follow a Pareto power law. For this group, income is largely driven by capital (investments). This distribution is characteristic of runaway, multiplicative feedback loops defined by extreme concentration.
Whilst the majority of us exist in a state of maximum income and wealth entropy – the BG model – the siphon effect constantly drains our ‘thermal energy’, effectively cooling us (freezing us out of wealth growth), with the heat being pumped up to the elite. This means we can all be poorer in a more random (unpredictable) way!
This division is driven by the fundamentally different mechanisms through which each group accumulates wealth. The majority relies on additive growth from labour:
- A worker’s wealth grows linearly (e.g.,
wealth_next_year = wealth_this_year + $X). - This has been confirmed by real world data: IRS data from 1983-2018 show that income below the top 4% follows the exponential distribution with remarkable precision.5
- The wealth of the people in this box is largely work income based. Money moves around through transactions, but the total wealth or money is largely conserved. Over time, this tends to settle into a maximum entropy state. Whereas for the very wealthy we have multiplicative compounding processes.
In contrast, the top tier benefits from multiplicative growth driven by capital returns:
- A billionaire’s fortune compounds exponentially (e.g.,
wealth_next_year = wealth_this_year × 1.08). - Unlike labour income, capital can grow and compound unbounded by the number of hours in a day – ‘making money whilst you sleep’.
- Money grows proportional to itself, for example a 10% return on $1 million equals $100,000, whilst a 10% return on $1,000 equals $100. The rich get exponentially richer with each compounding event.
- This mathematical distinction—not inherent differences in talent or effort—is a primary engine of accelerating wealth concentration, as capital’s exponential growth will always outpace labour’s linear accumulation over time.
- This mathematical asymmetry, where capital’s multiplicative growth outpaces labour’s additive growth, provides the micro-foundational evidence for the macro-level
r > gdynamic articulated by Thomas Piketty.
Econophysics sits alongside other heterodox approaches—like complexity economics, post‑Keynesian, and institutional economics—as an additional lens. It is not yet mainstream in journals, academia or government departments, but it has a strong empirical track record in areas like income and wealth distributions.
Economic inequality does not exist in a vacuum; it is magnified and entrenched by systemic discrimination based on wealth, gender and race. These intersecting disadvantages create profound barriers to opportunity, social mobility and well-being.
New technologies, and AI particularly, are going to entrench and worsen these issues unless we have a radical approach to wealth management and distribution and also to some public AI and a public share of ownership of all major AI technologies (which after all are built on top of the entire human corpus of knowledge).
The Global Wealth Freeze
The global economy has entered a state of “Oligarchic Freeze.”
As wealth concentrates, it loses its productive function. For example, each billionaire does not consume $1 billion annually, instead their capital sits in financialised assets (shares, real estate etc.) that generate returns without additional productive activity. This creates:
- Socialists for Risk/Capitalists for Reward: As the General Financial Crisis showed, the powerful have socialised the very systemic risks they help to create to maintain or grow their share of wealth whilst privatising the rewards.
- Stagnation: Capital is not deployed into new ventures.
- Financialisation: Wealth pursues returns in asset bubbles rather than innovation.
- Systemic Risk: When bubbles burst, the entire system destabilises (2008, 2020, etc.) and the wealthy use their influence and power to ensure the whole society bails them out.
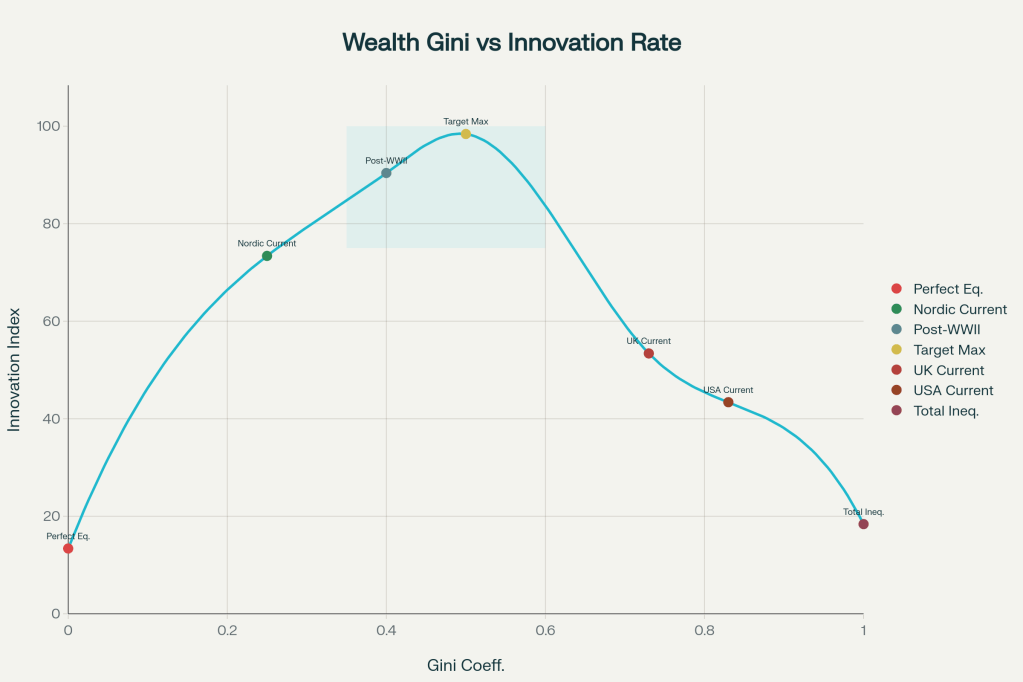
In both developed and developing nations, wealth concentration has reached historically unprecedented levels, with Gini coefficients ranging from 0.73 (United Kingdom) to 0.83 or higher (Russia / United States). This extreme inequality is not a natural outcome of free markets, but evidence of systemic distortion that suppresses economic dynamism, innovation and human agency.
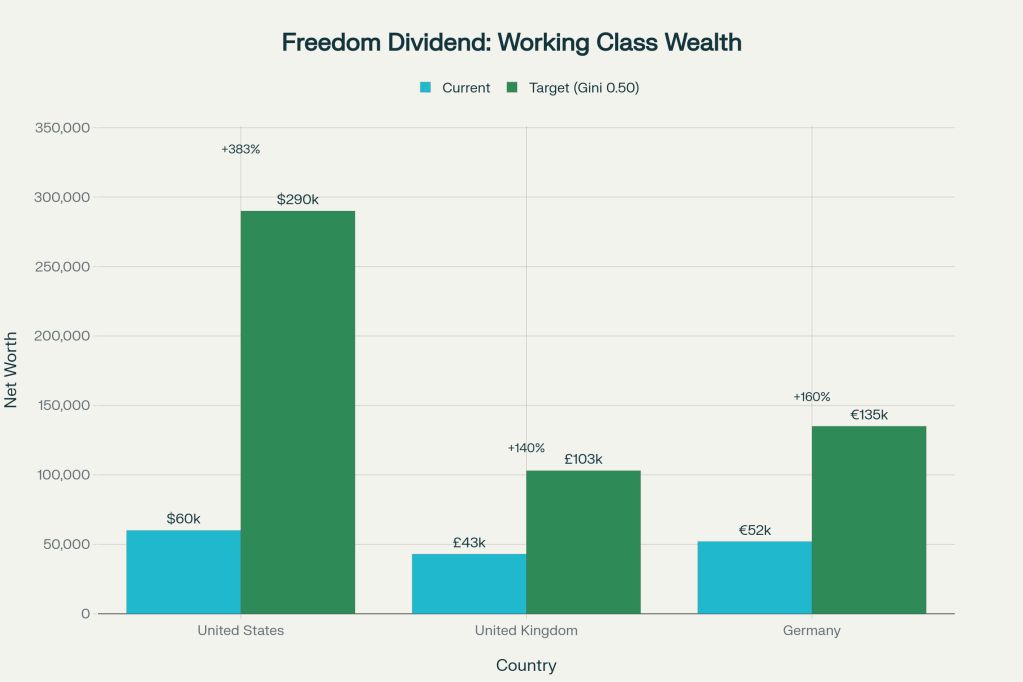
Drawing on econophysics, thermodynamics, and empirical economic data a compelling argument can be made for transitioning to a Boltzmann-Gibbs wealth distribution (Gini equivalent of 0.45-0.50). Such a move would:
- Quintuple the wealth of the bottom 50% of the US population (from $60,000 to $290,000 average net worth)
- Double the wealth of the British working class (from £43,000 to £103,000)
- Increase the wealth of the middle class.
- Unleash innovation by expanding the population with capital sufficient for entrepreneurship
- Increase total economic output by restoring purchasing power to the majority
- Stabilise financial systems by eliminating the boom-bust cycles driven by oligarchic concentration
- Restore genuine freedom of action to billions of people globally
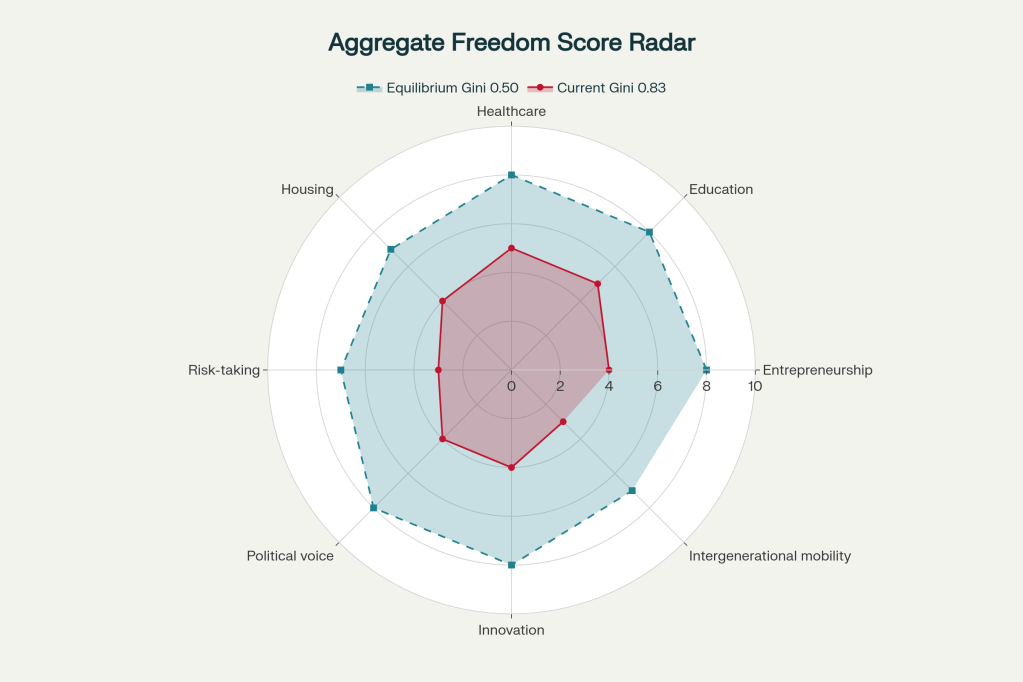
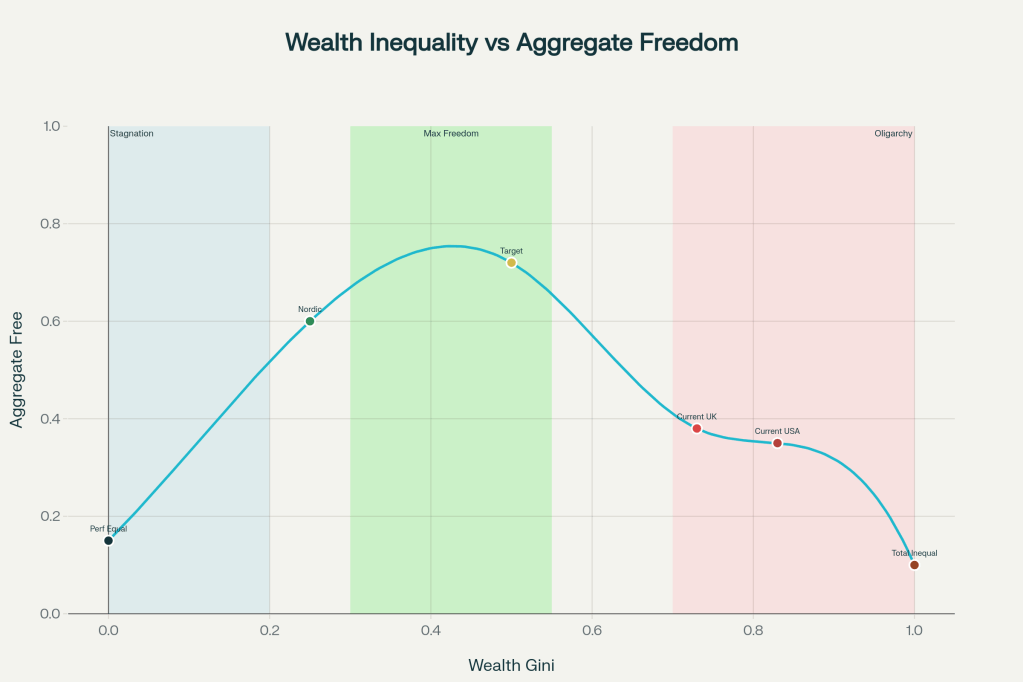
As the above chart shows a move to Gini 0.5 would have a major impact in many different dimensions of freedom:
- Axes (0–10 scale): Entrepreneurship, Education, Healthcare, Housing, Risk‑taking, Political voice, Innovation, Intergenerational mobility.
- Red polygon – “Current Gini 0.83”: lower scores across all eight freedoms, representing constrained human agency under high inequality.
- Blue dashed polygon – “Equilibrium Gini 0.50”: consistently higher scores on all dimensions, representing expanded agency in a moderate‑inequality, near‑equilibrium system
This is not socialism or forced equality. Rather, it represents a return to a more more stable equilibrium state of a free market system unconstrained by rent-seeking, dynastic capital accumulation, and regulatory capture. Roughly speaking, the top 3% have “enclosed” the capital, leaving the bottom 97% in a low-energy state where they lack the agency (real freedom) to enjoy their lives fully, take risks and drive the economy.
Note: here ‘equilibrium’ does not mean a frozen, reversible state, but a statistically stable band in an evolving path‑dependent system—more like a dynamic steady state than a static balance.
But no matter who is in the White House on January 20th, 2021 or January 20th, 2025, none of this ends. All of our coordination games are now competition games. That’s the new equilibrium. This is a permanent change.6
In fact this is not theoretical; post-WWII in the USA & UK (between 1950-1973) we effectively had these conditions. The Gini was approximately 0.48-0.52 and the system worked brilliantly (4.5-5.5% growth, innovation, social mobility and social stability). This was the golden age (at least domestically for many people) when everyone felt their lives had improved and the future was brighter for their children. That is because an entropic distribution of wealth is a mathematical statistical signature (shape) of a fair society and economy.
A move to a scientifically fairer and more useful distribution of wealth would raise billions of people out of poverty and debt slavery, increase the wealth of the working class, increase the wealth of the middle class and give them greater political power and maximise “Freedom of Action” (the ability to undertake more unusual and therefore potentially more useful work) for the entire population.
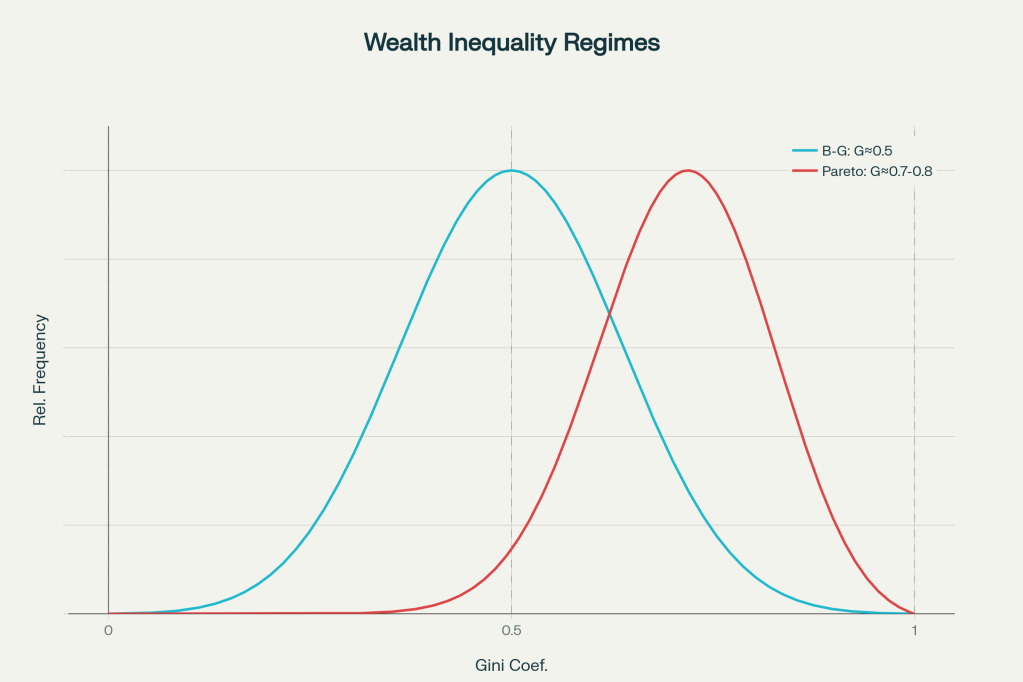
In short, on a Gini scale, the bell curve shape of our economies needs to be translated leftwards significantly. This will move the political dynamic and the Overton window back to a more stable central position.
much if not most of our current socially and politically dominant issues and crises are really just derivatives of this extreme concentration of power and wealth
These far right racists and dis-compassionate narratives are pushed by those wielding extraordinary power, it is a necessary narrative fiction for them to generate and maintain our current unholy gamed system (“for God’s sake don”t look up” / “punch down at every opportunity”).
The Cold Box Trap
We must first understand the nature of this economic prison and how it is built and maintained if we wish to effect meaningful change from the current Oligarchical stranglehold – The Box (The System) and Its Natural State
The system being analysed (the “Box” where most people live) is the economy, viewed through the lens of statistical mechanics.
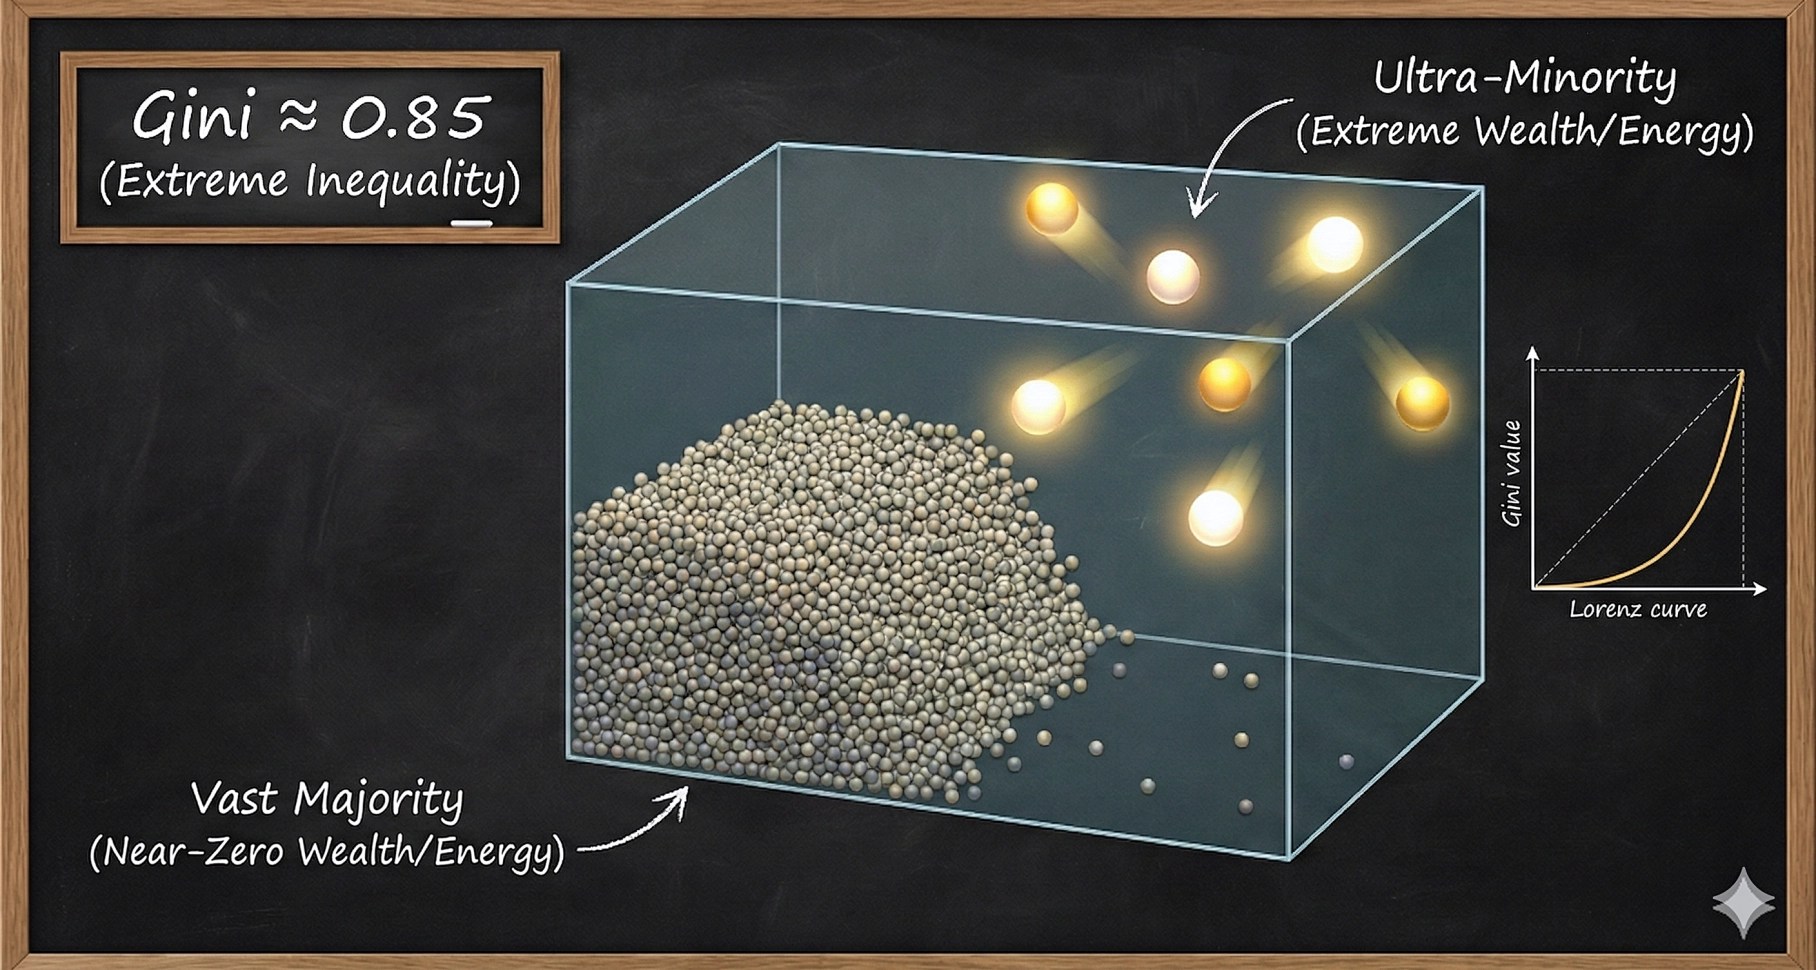
- Natural Equilibrium (The Ideal Temperature): In a closed economic system where total wealth is conserved and exchanges are random and fair, the distribution of money naturally converges to the exponential Boltzmann-Gibbs (BG) distribution. This BG distribution mathematically corresponds to a Wealth Gini coefficient of 0.50. This Gini≈0.50 state is the Maximum Entropy state, representing maximum natural randomness, fluidity, and maximum possible multiplicity given the constraint of fixed average wealth.
- Current State (The Freeze): Current economies, operating at Gini coefficients between 0.73 and 0.85, represent an artificially “pressurised” or “frozen” state that is far from this natural thermodynamic equilibrium. The high inequality means the system is rigid and non-fluid, analogous to “Steam under extreme pressure” or a phase transition failure.
The Siphon (Anti-Entropic Forces and Concentration)
The siphoning mechanism explains how the system is forced away from its natural Gini≈0.50 state:
- The Wealthy Elite (The Small Box): A small group, identified as the “super-thermal” tier (typically the top 2% to 4% of the population), sees its wealth follow the Pareto power law distribution. The Pareto tail is a characteristic of runaway, multiplicative feedback loops.
- Siphoning the Heat (Wealth Condensation): The Pareto distribution is sustained by powerful anti-entropic forces that actively concentrate wealth, opposing the randomising force of the BG core. These mechanisms include:
- Capital Law vs. Income Law: The wealthy operate under the “Capital Law” (multiplicative growth, where money makes money) while the majority operates under the “Income Law” (labour income, or additive exchanges).
- Rent-Seeking and Capture: Mechanisms like monopoly power, regulatory capture, and enabling unlimited intergenerational wealth transfer (e.g., estate tax elimination) ensure that capital accumulation creates artificial inequality.
The Consequences (Colder and Less Exergy)
The primary consequence of the Cold Box Trap is the suppression of potential activity and capability for the majority:
- Colder and Poorer (The Thermal Tier): The vast majority (the “thermal” core, ∼97%) is characterized by an exponential distribution of income and wealth that statistically drives agents toward low individual wealth. This population is trapped in “survival mode” or a “poverty trap” due to a lack of liquidity.
- Loss of Ability (Lack of Freedom of Action): This state results in low “Aggregate Freedom of Action”. Freedom, in this thermodynamic sense, is defined as Capability—the actual financial power (potential energy) to say “no,” take risks, and innovate. A citizen with zero net worth is metaphorically trapped in a gravity well, unable to move unless acted upon by an external force.
- Concentration of Exergy: While the total money (wealth) in the system is conserved (or is treated as such for modelling purposes), the quality or usefulness of the energy (known as Exergy) is pushed to the top.
Exergy measures the useful work potential of energy, which tends to be correlated with its economic value (e.g., electricity is generally more valuable than crude oil).As wealth concentrates, capital loses its productive function. The highly concentrated capital is often deployed in financialised assets (asset bubbles, speculation) rather than being deployed into productive new ventures or innovation. This concentration leads to a situation where energy is dissipated as heat rather than productive work. Furthermore, the consumption of the ultra-wealthy (e.g., super-yachts) is considered high-entropy waste, where the utility gained is small relative to the high exergy cost, thereby depleting the finite, low-entropy resources required for long-term economic viability.
To escape this trap, we require policy interventions designed to reverse the concentration—effectively managing the entropic parameters, thinning the Pareto tail (α), and raising the thermal floor (T or average wealth) of the majority.
Understanding Econophysics
First we need to understand some key, and often misunderstood concepts from physics and information theory.
Thermodynamic Entropy (The Second Law)
The foundational definition posits entropy as a measure of energy dissipation in physical systems.
Economic production is inherently an anti-entropic process; it requires the continuous consumption of finite, low-entropy resources (ordered energy) to maintain ordered, low-entropy structures such as capital, infrastructure, and human life. The historical foundation of economic growth, from the advent of steam engines to the transmission of solar energy through agriculture, highlights the profound importance of energy flow.
The “Entropy Law,” championed by Nicholas Georgescu-Roegen, fundamentally shifts economic focus by highlighting the unavoidable reality of resource depletion and the production of waste (high entropy) that occurs in all production processes. Economic output has historically depended on increasing supplies of high-quality energy (i.e. Exergy). A truly “useful” economic system must therefore address the conflict between the short-term distribution of monetary wealth and the long-term imperative of minimising the generation of external thermodynamic entropy.7
Information Entropy (Shannon/Theil)
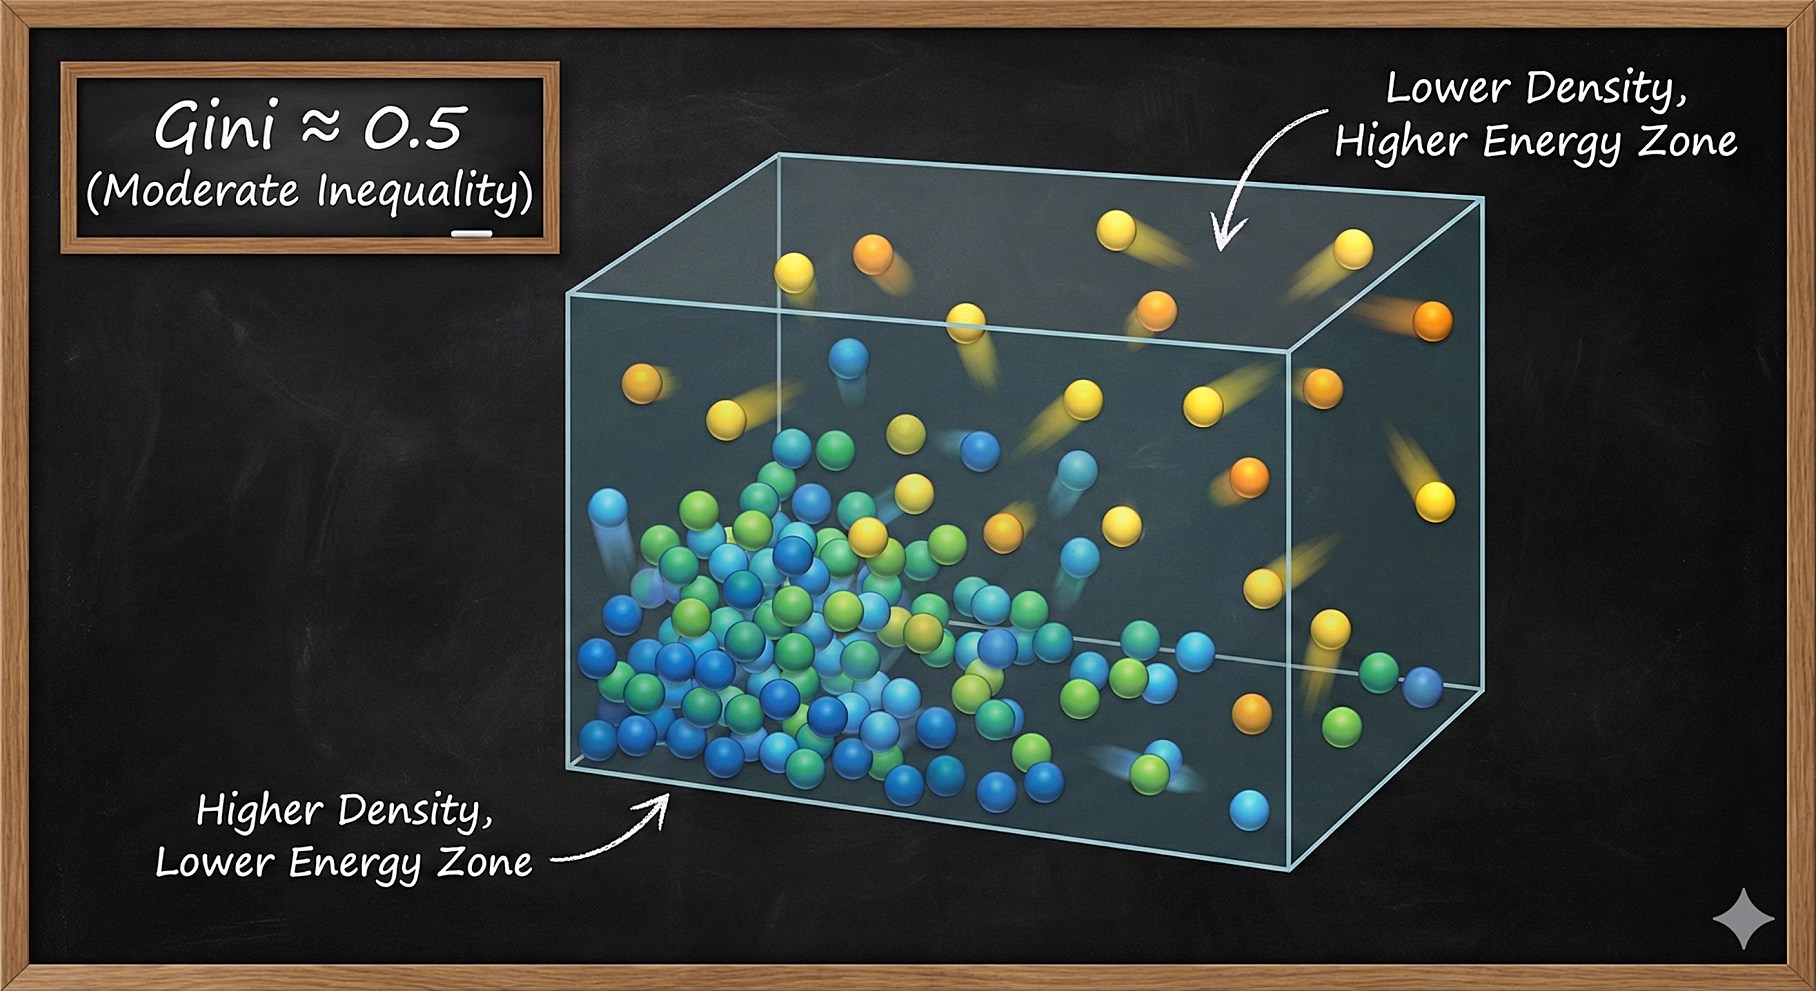
In information theory, entropy quantifies the uncertainty or randomness within a distribution. The concept of fairness aligns mathematically with the principle of maximum entropy. In a system with finite resources, ‘maximum randomness’ does not mean everyone gets the same amount (uniformity). Instead, the most probable, natural distribution is the exponential (Boltzmann-Gibbs) distribution, since that gives the outcome where it is the most difficult to predict where any wealth resides in a member of the population.This represents the state of maximum entropy given the constraint of a relatively fixed total wealth/ money supply.
Statistical Mechanics Entropy (Boltzmann-Gibbs)
Econophysics applies statistical physics to economic systems, using entropy to relate the macro-level distribution of wealth to the microscopic interactions (transactions) of agents. This concept is crucial for modelling the natural, emergent structure of inequality resulting from vast numbers of random transactions, a development that challenges many assumptions in conventional economics.8
Policy can choose whether we live in a moderate‑inequality Boltzmann‑like regime or in an extreme Pareto‑dominated oligarchy.
Key Econophysics Applications and Microscopic Mechanisms Summary
| Model Class | Application Area | Empirical Phenomenon Explained | Underlying Microscopic/System Mechanism |
| Agent-Based Models (ABM) | Financial Returns/Volatility | Fat Tails (Leptokurtosis) Long Memory/Volatility Clustering | Convergence of agents on shared technical trading strategies; collective imitation Heterogeneous investment horizons of agents |
| Kinetic Exchange Models (KEM) | Income & Wealth Distribution | Pareto Power Law Tail (Rich) | Multiplicative exchange dynamics leading to wealth condensation (oligarchy) |
| ABM (Policy Extension) | Regulation/Systemic Risk | Crowding and Optimal Leverage | Simulation of non-linear feedback loops generated by policy constraints on heterogeneous agents |
Like any high‑dimensional modelling approach, agent‑based and kinetic exchange models can fall into their own ‘black box’ trap9 if they are not disciplined by data, robustness checks, and transparent sensitivity analysis. The value of econophysics lies not in piling on parameters, but in using simple, empirically grounded rules that reproduce real stylised facts.
However, it must also be noted that econophysics has had limited impact on mainstream policy, perhaps due to translation issues: many results are written in physics language and published on physics literature platforms. One purpose of this article (and the dashboard/FAQ that go with it) is to restate those statistical mechanics insights in terms that policymakers, economists, and finance practitioners can more easily make sense of.
Constructive Chaos
Econophysics suggests that for maximum vitality, markets and economies function best near the edge of chaos—a state characterised by managed, constrained disorder. Planned economies, which rely on centralised authority, inherently suppress the potential for entropy increase (diversity and scale), leading to reduced economic vitality and systemic inefficiency. Conversely, market competition fosters continual innovation and allows the expression of diverse preferences, driving a controlled increase in system entropy along dimensions of scale and structure. The utility of the system depends on finding a dynamic steady state that maximises internal fairness (wealth distribution entropy) without jeopardising long-term biophysical constraints (the need for useful energy).
Econophysics is not a call to throw away every tool in neoclassical economics. General equilibrium models remain useful for certain idealised allocation and pricing questions. What they cannot capture are out‑of‑equilibrium dynamics, path dependence, and emergent phenomena in many‑agent systems. Econophysics and complexity science are best seen as a branch of statistics that complements, rather than replaces, traditional economics in domains where instability, feedback loops, and non-deterministic shocks dominate.
It is also self-evidently true that people are not gas molecules, the value of the analogy and the statistical approach is in explaining distributions in aggregate, not individual behaviour, motives or value.
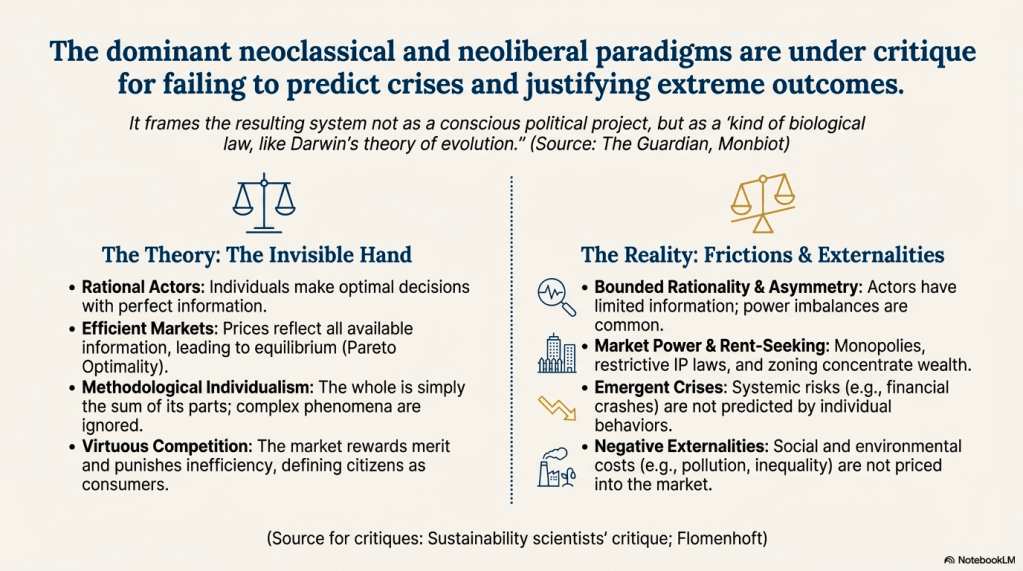
The Common Critiques
There are many critiques of this approach most of which can be grouped together.10 The footnote and FAQs deal with some of these in more detail. Obviously many of these self-serving narratives pushed by those (and their bought political and media channels) that currently benefit the most from this broken system.
Measuring Inequality
Before we can dive into potential solutions to our socio-economic problems, we first need to understand the differences between different ways in which we measure inequality.
Painting the Picture: The Lorenz Curve
Perhaps the most intuitive way to grasp inequality is to see it. The Lorenz curve offers a powerful graphical representation of how income or wealth is distributed across a population.
- The core concept is straightforward: Imagine lining up everyone in a country from the poorest to the richest. The Lorenz curve plots the cumulative share of income earned against the cumulative share of the population, showing what percentage of the country’s total income the bottom 10% has, what the bottom 20% has, and so on, all the way up to 100%.
- On the graph, a straight 45-degree diagonal line represents a state of perfect equality. On this line, the bottom 20% of the population would hold 20% of the income, the bottom 50% would hold 50% of the income, and every person would have exactly the same share of the economic pie.
In the real world, no society achieves this target (neither would they wish to). The actual Lorenz curve always bows beneath the 45-degree line. The further the curve bows away from the diagonal, the greater the degree of inequality. A deep, pronounced curve indicates that a small portion of the population at the top holds a disproportionately large share of the total income. For example, the Lorenz curve for Brazil bows out much further than for Norway. This visually demonstrates that the poorest half of the population in Brazil holds a much smaller slice of the total economic pie than the poorest half in Norway, signaling a higher level of inequality.
The Lorenz Curve gives us a powerful visual snapshot. A deeper curve means a more unequal society. While the Lorenz curve is excellent for visualisation, it’s often more practical to have a single number to compare inequality across different countries or time periods.
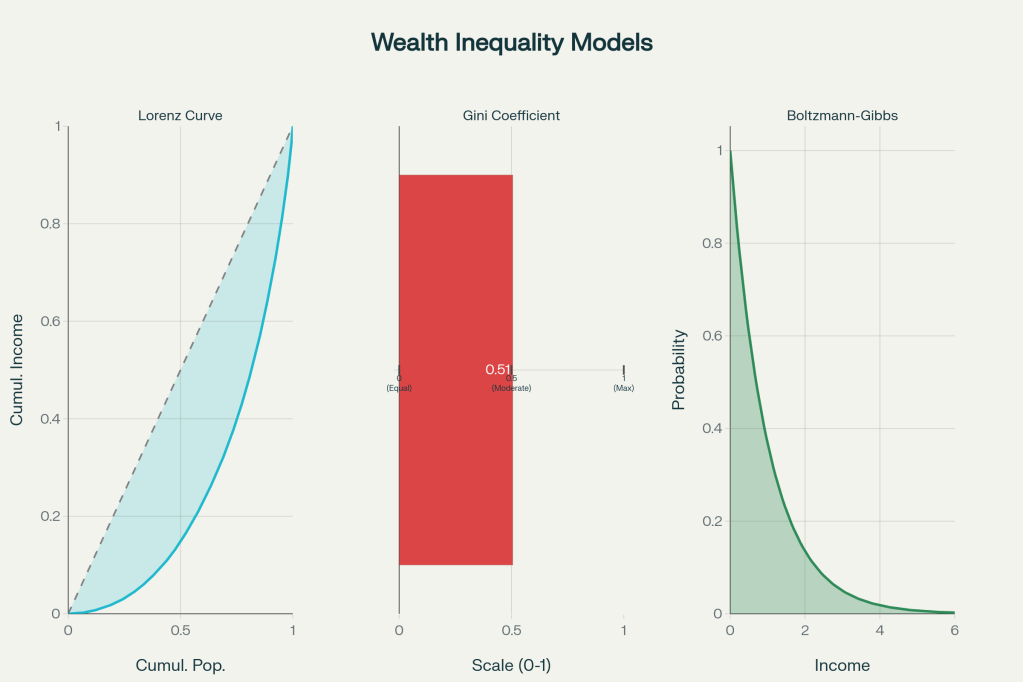
The Gini Coefficient: Inequality in a Single Number
The Gini coefficient is the most widely used inequality metric because it compresses the Lorenz curve into a single number between 0 and 1, defined as the area between the Lorenz curve and the line of perfect equality, divided by the total area under that line. A value of 0 represents perfect equality, and 1 represents maximal inequality. In statistical‑equilibrium models where income follows a Boltzmann–Gibbs (exponential) distribution, the associated Gini often lies near 0.5, so G≈0.5 can be interpreted as a thermodynamic‑style equilibrium benchmark in that framework too.
The Gini scale also benefits from being easy to interpret:
• Gini = 0: This represents perfect equality. Everyone has the exact same income. In this scenario, the Lorenz curve would be the 45-degree line (i.e, there would be no shaded area below that line).
• Gini = 1: This represents maximum inequality. One person has all the income, and everyone else has none. The Lorenz curve would run along the bottom and right-hand axes of the graph.
The Gini coefficient also allows for direct comparisons between countries. The table below shows the wealth Gini for several nations, highlighting the primary drivers behind their levels of inequality according to an analysis of global wealth.
| Country | Wealth Gini | Primary Driver (What this means for students) |
| South Africa | 0.81 | Reflects a deep structural legacy from the apartheid asset gap, showing historical injustices have long-lasting economic consequences. |
| Brazil | 0.82 | Driven by historical disparities in land ownership and high barriers to finance, making it hard for many to build wealth. |
| Russia / USA | 0.82-0.85 | Caused by a massive concentration of financial assets in the hands of a few (the “Oligarch Effect”), leaving very low median wealth for others. |
In the United States, a significant shift in income distribution has occurred over the last several decades. In 1975, the bottom 90% of earners received about 67% of total taxable income. By 2015, that share had fallen to under 50%. According to a study by the RAND Corporation, this upward redistribution of income has cost American workers a staggering $50 trillion over the past several decades.
While income and wealth are crucial, they don’t tell the whole story. Is a person’s well-being solely determined by their bank account? This question leads us to a more holistic measure of deprivation and the need to factor in augmented wealth being the resources made available to citizens in their country (such as access to free education, healthcare, housing etc).11
Boltzmann-Gibb KLD Index – modified Theil Index
A mathematical tool used to measure distance from the perfect equality baseline (Kullback-Leibler Divergence) can be applied to measure distance from any alternative reference distribution:12
- Generalised Divergence Measures: The general principle of inequality measurement based on information theory involves quantifying the divergence between the actual distribution and a specified historic, normal, targeted or expected distribution.
- The KL Divergence (or relative entropy): generally defined as the divergence of an observed density (f1) from a reference density (f2).
- Boltzmann-Gibbs baseline (Gini 0.50): we use the standard KL Divergence formula, setting the reference distribution (f2) to the exponential distribution.
The critical mathematical advantage of the Boltzmann-Gibb KLD Index index over the Gini coefficient is its full decomposability: decomposability allows the total measured inequality to be rigorously separated into inequality between groups (e.g., regional or gender-based gaps) and inequality within those groups. This is essential for policy engineering, enabling policymakers to inject targeted interventions (mobility) precisely where structural rigidity (concentration) is highest, thereby maximising overall system efficiency and fairness.
Comparative Data On Inequality
USS – Impact Analysis: Gini 0.83 → Gini 0.50
The United States currently operates at a Gini coefficient of around 0.828, placing it in the top 15% most unequal nations globally (above most developing countries).
Current Wealth Distribution (2024)
| Population Percentile | Average Net Worth | Total Wealth Share | Cumulative Share |
| Top 0.1% | $176,600,000 | 32% | 32% |
| Next 0.9% | $41,000,000 | 27% | 59% |
| Next 4% | $8,500,000 | 20% | 79% |
| Next 15% | $924,000 | 15% | 94% |
| Next 30% | $200,000 | 5% | 99% |
| Bottom 50% | $60,000 | 1% | 100% |
Transition to Gini 0.50
To reach a Gini of 0.50 while maintaining total wealth (not destroying capital), the distribution would need to shift to:
| Population Percentile | Target Net Worth | Change Factor | Interpretation |
| Top 0.1% | $63,500,000 | -0.64x | Oligarchy → Luxury. Lifestyle unchanged, political power reduced. |
| Top 1% | $15,200,000 | -0.63x | Dynasty → High status. Multi-generational idle wealth eliminated. |
| Top 5% | $3,800,000 | -0.55x | Elite → Professional class. Remains wealthy but not untouchable. |
| Next 15% | $1,200,000 | +0.30x | Anxiety → Autonomy. Debt-free home ownership becomes standard. |
| Next 30% | $450,000 | +2.25x | Precarious → Secure. College funds, emergency savings routine. |
| Bottom 50% | $290,000 | +4.83x | Move from SURVIVAL to AGENCY: The working class becomes a capital-holding class and escape debt slavery. |
The Bottom 50% Transformation:
A 5x increase in average net worth (from $60,000 to $290,000) for the American working class represents a civilisational shift:
- Homeownership: No longer dependent on bank mortgages. 80%+ can purchase property outright or with minimal financing.
- Entrepreneurship: A $290,000 nest egg enables starting businesses that currently require venture capital.
- Education: College becomes debt-free for middle-class families.
- Negotiating Power: Workers can refuse exploitative jobs. Labour market power shifts decisively toward workers.
- Healthcare: Medical bankruptcy essentially disappears.
- Innovation: Garage-scale businesses (like Apple, Microsoft, Google) become accessible to anyone with an idea.
Total Wealth Quantification
- Current Total US Wealth: $193 trillion
- Redistributed Among 330 million people: $584,000 per person
- Bottom 50% current total: $10 trillion ($60,000 × 170 million)
- Bottom 50% target total: $49 trillion ($290,000 × 170 million)
- Wealth to Transfer: $39 trillion
This is not confiscatory; it is a gradual rebalancing to a more useful distribution (which would need to take place over 20-20 years) and would require approx 2-3% annual equity transfers from ultra-high-net-worth individuals.
We can do the same charts for many other Western countries and the results are quite similar. For example we can do a world chart showing the extraordinary benefit it would have for billions of people whilst rich people would still remain rich!:

See here for more interactive charts: https://peter-howitt-compossible.github.io/econophysics-wealth-dashboard/
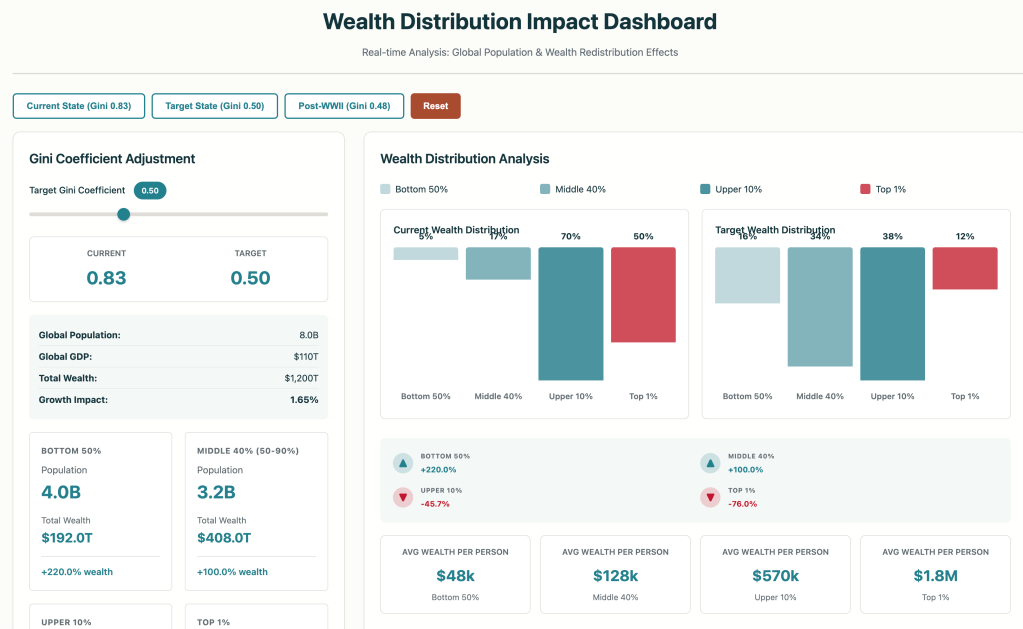
Wealth-Distribution-Dashboard: note the figures are, by nature, rough estimates produced by AI and based on the assumption the total wealth remains constant when in fact total wealth would increase because of the unlocking of human potential and capital.
The Equality Engine
So we know the scale of the problem and the likely solution.
So how do we go from here to where we need to be?
On its own, econophysics is purely descriptive: it tells us what wealth and income distributions tend to look like under given micro‑rules. To be useful for policy, it has to normative: combining statistical mechanics with institutional economics and behavioural finance to design better rules of the game. The Sovereign Wealth Fund, Universal Basic Capital, and anti‑flight measures sketched out here are exactly that – an attempt to turn stylised facts and kinetic exchange insights into concrete system design. In complexity terms, the real test of this framework is not whether it matches every data point, but whether it helps us design a better system: one that acknowledges emergent inequality, uses continuous, transparent interventions to keep it in a productive band.
The comprehensive framework proposed in the sources for achieving this structural realignment (Gini 0.83 > Gini 0.50) is designed for implementation over a transition period of approximately 25 years. The best ways to move western countries, like the UK and USA, toward a Gini of 0.50 rely on a three-pillar policy mechanism designed to address the root causes of wealth concentration and restore competitive market dynamics:
The Core Mechanism: Structural Asset Redistribution via a Sovereign Wealth Fund
The central mechanism involves shifting from taxing mobile cash to transferring fixed equity, accomplished via a Sovereign Asset Fund (SAF) or Sovereign Wealth Fund (SWF) capitalised by an annual asset charge.
- Annual Equity Transfer (Share Levy): The mechanism requires a mandatory annual transfer of corporate shares and property (equity), such as 2%, from ultra-high-net-worth individuals or the top 1-3% of wealthy citizens into a National Sovereign Wealth Fund.
- Payment in Shares: Crucially, the transfer must be structured as a “asset levy” payable in scrip (equity) or shared ownership (land), not cash, to prevent liquidity crises that typically plague conventional wealth taxes. This mechanism functions as a slow-motion socialisation of capital.
- Preventing Re-consolidation: This transfer must be ongoing (not a one-time event) to provide a continuous counteracting force against the tendency for wealth to re-concentrate. At the Gini 0.50 equilibrium, minimal transfers would be needed as the system becomes self-sustaining.
- Capital Mobilisation: For the US, this mechanism is projected to mobilise approximately $39 trillion over 25 years. For the UK, the wealth transferred is estimated to be around £2.4 trillion.
The Redistributive Component: Universal Basic Capital (UBC)
The capital generated by the SWF is used to finance endowments for the majority of the population, providing an essential “thermal floor” for the economy.
- Universal Basic Capital (UBC) / Universal Basic Dividend (UBD): The dividends from the Sovereign Fund are allocated to citizens, potentially as a Universal Basic Capital endowment (or “Baby Bond”) paid to young adults to ensure no citizen starts with zero leverage.
- Wealth Transformation: Achieving Gini 0.50 would quintuple the net worth of the bottom 50% in the US (from an average of $60,000 to $290,000) and double the wealth of the British working class (from £43,000 to £103,000).
- Maximising Freedom and Innovation: This influx of capital maximises “aggregate freedom of action,” which is the capability for people to achieve valuable functionings such as starting a business or buying a home. The goal is to capitalise the poor, enabling widespread entrepreneurship and risk-taking.
Protecting the System: Anti-Flight Measures and Regulatory Reform
To ensure national policy effectiveness against the high mobility of modern capital, measures must be implemented to prevent capital flight and reduce the system’s structural bias toward capital accumulation.
- Exit Tax: A mechanism, such as a 40% exit tax, is required to prevent capital flight when ultra-wealthy individuals renounce citizenship.
- Dismantling Anti-Equilibrium Mechanisms: The structural shift requires removing the current policy constraints that maintain Gini 0.83, including preferential capital gains taxation, estate tax loopholes, and monopoly power.
- Taxing Capital Income: Implementing mark-to-market taxation of unrealised capital gains would capture wealth accrual in real-time, attacking the mechanism of dynastic concentration driven by r > g (rate of return on capital exceeding economic growth).
Complementary Policy Approaches (The Triad of Equity)
The most robust path to Gini 0.50 involves supplementing the Sovereign Fund with broader structural and fiscal changes, focusing on both redistribution and pre-distribution.
- Universal Basic Services (UBS): Providing essential needs, as augmented wealth, like healthcare and education as public goods is considered a superior approach to purely monetary redistribution for maximising “aggregate freedom”.
- Progressive Tax Triptych: Advocating for a comprehensive overhaul of the fiscal system using a progressive tax triptych, combining the wealth tax (via the SWF), highly progressive inheritance taxes (up to 50–60% for top bequests), and progressive income taxes. The purpose of taxing wealth and inheritance is structural—to reduce the private after-tax rate of return (r) below the rate of growth (g), thus ending “dynastic capital accumulation”.
- Pre-distribution and Corporate Reform: Implementing radical corporate governance reforms, such as giving workers equal representation on company boards (co-determination), to pre-distribute economic rewards away from shareholders and reduce top management pay. This disperses economic power within society.
- Labour Policies: Policies proven to reduce inequality include increasing trade union membership and social dialogue, enhancing workers’ rights, and increasing the minimum wage.
- Climate Finance: The capital injection resulting from the Gini 0.5 transition provides millions of households with the liquidity necessary to fund green initiatives (e.g., solar panel installation, EV purchases), accelerating the green transition from the bottom up.
The implementation is modelled in five phases over 25 years, beginning with establishing the foundation (Years 1-2) and launching the equity transfers (Years 3-5), culminating in reaching a more stable equilibrium (Years 20-25).
By implementing the three-pillar strategy (Sovereign Equity Fund, Universal Basic Capital, and Capital Flight Controls), policies act as a thermostat and relief valve, allowing the system to shed its artificial pressure and settle into a fluid state where energy (capital) flows freely, maximising the useful work (innovation, entrepreneurship, growth) available to the largest number of people.
What is Entropy?
If you would like to spend more time surfing the seas of entropy (perhaps one of the most misunderstood concepts in physics) – please dive in:
Footnotes:
- Specifically, the richest 10% of the world’s population account for 54% of total global income and 74% of total global wealth, while between 2000 and 2024, the richest 1% captured 41% of all new wealth, compared to only 1% captured by the bottom half of humanity. The report stresses that this extreme inequality is destabilising, undermining social and political cohesion, eroding trust in democratic institutions, and hindering the ability to deal with planetary challenges. The report makes the immediate and priority request for the establishment of an International Panel on Inequality (IPI). This new body would serve as a technical resource, supplying governments and multilateral agencies with authoritative assessments and analyses of inequality trends, drivers, and the impacts of proposed policies, thereby enhancing fundamental knowledge in the field. Furthermore, the report outlines “New Blueprints to Reduce Inequality,” with a specific emphasis on global coordination and structural reforms. Key proposals include:
– reforming the international tax system to ensure fair taxation of multinational corporations and the ultra-rich, which may necessitate a global asset register and a global minimum tax on wealthy individuals:
– improving global access to knowledge, food, medicine, and digital technology
– reforming macro policies to rebuild public wealth
– overhauling the global financial architecture to provide debt restructurings and liquidity support to developing countries. These actions are framed as necessary to reverse the policy choices that currently exacerbate inequality.
‘Statement from the World Inequality Lab on the G20 Extraordinary Committee of Independent Experts’ Report on Global Inequality’, Nov 04 2025. ↩︎ - – I use Gini 0.5 as the target for simplicity but a range would be better (e.g. 0.48-0.52). However, it is simpler to give one benchmark number to run the analyses and it suffices to make the case out at a high level.
– Baseline figures for life expectancy, homeownership, and related outcomes are drawn from a wide range of recent official and research sources (e.g. national statistics, international datasets, and major reports).
– Forward-looking estimates are scenario-based, not forecasts. They are built from transparent assumptions about changes in inequality, investment, and policy (e.g. a transition from Gini 0.83 to ~0.50 over 20–25 years), combined with ranges implied by empirical literature on inequality, health, and social outcomes.
– The projections should be read as ‘order-of-magnitude’ illustrations of direction and scale, not precise point predictions. They are intended for scenario analysis and policy design, not as precise forecasts. Most numeric values in the dashboards and charts are stylised scenario values, chosen to be plausible and illustrative for modelling purposes, not points set in stone.
–The dashboards and AI‑assisted charts in this article are there to make the concepts tangible, not to serve as high‑frequency predictors. The priority is conceptual transparency – clear mechanisms and orders of magnitude – not squeezing out micro predictive accuracy from a black‑box model. ↩︎ - The statistical–mechanical picture used here is a tool, not a claim that economies must obey the same laws as heat engines or gases. It borrows the mathematical machinery of equilibrium distributions to make sense of empirical income and wealth data, but it does not mean that money, work, or welfare must or can be treated as interchangeable with energy in a closed thermodynamic system:
– technically real economies are open, non‑equilibrium systems, constantly driven by policy, innovation, demographics, and shocks. Thermodynamic equilibrium models describe systems settling into a stable state, whereas financial markets and macroeconomies are often unstable, path‑dependent, and buffeted by crises. Actual markets do not reliably approach a well‑defined statistical equilibrium, which limits how far one can push a literal thermodynamic interpretation.
– there is no strict conservation law for money or wealth analogous to conservation of energy. New money is created and destroyed through credit, banking, and policy decisions, and wealth can be revalued by price changes and institutional reforms. In fact, just such choices have been made, and they have been accelerated since the Global Financial Crisis, to amplify the differences between income and capital growth. The models that produce clean Boltzmann–Gibbs or Pareto distributions typically assume some form of conservation and a fixed rule set. These are not fundamental laws that constrains what policy can do and a system can be out of equilibrium for long periods without failing.
– this is not intended to be a fundamental framework for how societies must function, but a useful analysis and policy tool.
– using physics analogies and statistical tools carries a political risk: patterns that are easy to fit with elegant equations can sound like they are dictated by nature and therefore unavoidable. In reality, it is much more complicated. The point of using this framework is not to declare greater equality or inequality as a law of nature, but to give a clearer view of how the current rules generate a “freeze” on the vast majority of people and therefore where to apply leverage for change. ↩︎ - There are a number of primary mechanisms that cause capital (wealth) to exhibit a different, more concentrated distribution pattern—typically a Pareto power law—compared to the Boltzmann-Gibbs (exponential) distribution that characterises the majority of labour income including:
1. Additive versus Multiplicative Growth Dynamics: discussed above.
2. The “Forward Momentum” of Accumulation and Inheritance Unlike income, which is a flow of resources over a specific period, wealth is a stock that accumulates over time and can be transmitted across generations.
– Accumulation: Wealth inequalities possess “forward momentum” because accumulated assets generate their own income (rents, dividends, interest), which can be reinvested. If the rate of return on capital (r) exceeds the rate of economic growth (g), past wealth accumulates faster than the economy grows, inevitably increasing its concentration relative to labour income.
– Inheritance: The ability to transmit capital through inheritance allows wealth concentrations to persist and expand beyond the lifespan of the original earner, a dynamic that does not apply to labour income. This intergenerational transmission transforms temporary Pareto distributions (within one life) into permanent dynastic wealth concentrations, further widening the gap between the distribution of labour income and capital.
3. Heterogeneous Returns to Wealth (Scale Dependence) Capital distribution is further skewed because the rate of return on assets is not uniform; it increases with the size of the portfolio.
– Portfolio Composition: Wealthier households invest a larger share of their portfolios in high-yielding risky assets (like business equity and real estate), while poorer households hold low-yield safe assets (like deposits or bonds).
– Scale Advantage: “Super-investors” with large portfolios can access investment opportunities and financial advice that yield returns significantly higher than the inflation rate, whereas smaller investors often struggle to match inflation. This “return inequality” means that individuals at the top of the wealth distribution accumulate assets at a faster rate than those at the bottom, creating a thicker tail in the wealth distribution than would exist if returns were uniform.
4. Automation and Factor Shares Technological change, specifically automation, acts as a mechanism that separates the distribution of capital from labour income by shifting the demand for factors of production:
– Capital-Labor Substitution: Automation technologies substitute labour with capital, increasing the demand for—and often the returns to—wealth, while simultaneously depressing or stagnating wages for displaced workers.
– Uneven Distribution of Productivity Gains: Productivity gains from automation accrue disproportionately to the owners of the capital (robots, software, machinery) rather than the workers. This structural shift increases the “net capital share” of income, which feeds back into the multiplicative accumulation of wealth, further widening the disparity between the distributions of capital and labour income.
5. Institutional and Political Determination (Ideology & Policy) Wealth distribution is not solely the result of economic laws but is actively constructed by political and legal choices:
• Legal Coding of Capital: The distribution of wealth is shaped by how markets are legally constructed, including corporate governance laws and property rights. These “rules of the game” can pre-emptively distribute value to shareholders before taxes are even applied.
• Regime-Specific Outcomes: Historical comparisons, such as between Bulgaria and Czechoslovakia, show that institutional arrangements (like the nationalisation of industry or the collectivisation of agriculture) can completely eliminate or restructure the “between-class” inequality that characterises capitalist economies. This demonstrates that the divergence between capital and income distributions is contingent on the political regime.
• Tax Avoidance and Policy: The decline in progressive taxation and the proliferation of tax havens allow capital to accumulate at a rate (r) significantly higher than the growth of the economy (g), reinforcing dynastic wealth concentration in ways that labor income cannot replicate ↩︎ - See, for example, Danial Ludwig and Victor M. Yakovenko, ‘Physics-inspired analysis of the two-class income distribution in the USA in 1983–2018′, 2022. ↩︎
- Ben Hunt, Epsilon Theory, ‘Fell On Black Days’. ↩︎
- Importantly, not every economic quantity has a clean physical analogue: utility is not conserved the way energy is, and money creation and destruction complicate simple conservation pictures. When this article uses thermodynamic language, it is strictly about physical resources and statistical distributions of income/wealth, not about treating utility as a literal conserved field. ↩︎
- Thermodynamics of Inequality & Kinetic Exchange Models (KEMs): Beyond finance, econophysics provides powerful new frameworks for key macroeconomic issues, specifically the persistent and universal challenge of wealth and income distribution. Econophysics uses physics analogies (Entropy, KEMs) to model agent behaviour, leading to the observed BG/Pareto split. Kinetic Exchange Models (KEMs) are multi-agent dynamic models inspired by the statistical physics used to study energy distribution in gas particles. The fundamental hypothesis is that the economic exchange activity of individual agents (trades) can be analogised to the movement and encounter of gas particles exchanging energy. This framework is designed to explain the robust and universal features observed in income and wealth distributions globally.
– Decades of empirical investigation have shown that the distribution of wealth and income is never uniform. Econophysics has quantified these distributions:
The Elite Tail: The distribution’s tail, typically comprising the top 5 to 10 percent of agents in any country, reliably follows a Pareto power law.
The Majority: The majority of the low-income population follows a different distribution, often identified as either a Gibbs (exponential) or log-normal distribution.
– KEMs, such as the “Yard-Sale model,” provide a compelling mechanism for the origin of this inequality. Key results show that wealth distribution develops unequally among the population, regardless of the initial conditions of the exchange dynamics. The models show a natural tendency toward an equilibrium state where the majority follows the Gibbs distribution, while simple, random, multiplicative exchanges naturally lead to the formation of an oligarchy (extreme wealth condensation).
Policy Modelling: Inequality and Economic Mobility
– The robustness of the Pareto distribution in KEMs can imply that economic inequality is a highly probable, self-organising phenomenon driven by entropic, multiplicative interactions. This understanding suggests that policies designed to reduce inequality are not merely political preferences, but necessary, continuous, entropy-reversing inputs required to maintain a stable and equitable economic system. KEMs provide an essential quantitative, non-moral justification for intervention. In other words: some inequality is a highly probable emergent outcome of random exchanges and multiplicative processes; its exact level and structure, however, are strongly shaped by saving behaviour, taxation, welfare rules, and institutional design.
– KEMs are instrumental in modeling the impact of interventions such as taxation and redistribution processes, allowing researchers to study the dependence of the Gini inequality index on parameters like saving propensity, taxation rates, and welfare means-testing. Furthermore, KEMs have been used to study the critical relationship between inequality and economic mobility. Empirical data consistently reveal a remarkably general negative correlation between economic inequality and mobility. By analysing mobility dependence through the transition probabilities of the model, numerical solutions confirm this negative correlation, highlighting that addressing inequality is essential for fostering intergenerational fluidity. ↩︎ - A Black Box Trap:
– There is, however, a danger of the ‘Black Box Trap’. If we push complex models, machine learning, and high‑dimensional agent‑based simulations only for predictive accuracy, we risk ending up with opaque algorithms that no one really understands .
The success of econophysics in replicating complex market dynamics using sophisticated algorithms—particularly in the application of statistical modelling, machine learning, and AI in finance—introduces a new epistemic crisis: the loss of model transparency.
– The drive toward predictive performance has, in some areas, superseded the goal of conceptual understanding, resulting in models that operate as “black boxes”. For example, complex algorithms underlying high-speed trading contributed to dynamics, such as the 2010 “Flash Crash,” that participants themselves did not fully understand. This methodological drift risks replacing the quest for the causal why with simple correlation and pattern recognition (the statistical what). Jean-Philippe Bouchaud, a pioneer in the field, warned against the danger of the field losing its soul, suggesting that researchers might end up “forgetting ‘physics’ altogether, becoming mere data technicians”. Curve fitting is always a major risk in data modelling.
– The fundamental methodological dilemma facing complex systems modelling is therefore clear: Escaping the “Cold Box” risks entering the accurate but opaque “Black Box.” Future progress depends on balancing predictive power with conceptual depth and transparency. This requires complex models to focus on explainability—providing the microscopic origin for macro-behaviour—rather than merely optimising performance metrics. The goal here is not to replace one opaque box with another, but to use simple, explainable micro‑rules that generate the observed macro‑patterns, keeping the ‘physics’ – the causal why – firmly in view. ↩︎ - List of the standard critiques to justify such extraordinarily inequality that is also not useful:
The “Innovation Killer” Critique: “If you flatten wealth to Gini 0.5, you remove the incentive to be the next Elon Musk. Why work hard if I can’t keep all the billions?” A founder with $100M is just as motivated as one with $100B. By capitalising the bottom 50% and the middle class, we create millions of new entrepreneurs who currently can’t afford to take risks or build businesses.
The “Capital Flight” Critique:“If you tax assets at 2%, billionaires will just leave the US/UK, collapsing the economy.” This is why the 40% Exit Tax is non-negotiable. It makes leaving too expensive. You cannot abandon the world’s largest consumer markets (US/UK/EU) and expect to stay rich.
The “Government Competence” Critique:“The Government is wasteful. Giving them $39 Trillion in a Sovereign Fund is a disaster waiting to happen.” The Fund should be an index tracker (like Norway/Alaska), not a stock-picker. It doesn’t “run” companies – it just collects rents and dividends.
The “Human Nature” Critique: “Humans aren’t gas molecules. We have motives. These simple physics model ignores motive and merit and a dynamic system of intentional agents.” IRS data proves that wealth exchanges on average between 97% of people act like energy between gas molecules whatever their talent and motives individually. The physics analogy holds for everyone but the super rich. This confirms the “Two-Tier” or “Cold Box” thesis rather than disproving it.
We use the thermodynamic model to describe the underlying pressure of the system. Gravity pulls everything down (Physical Law). But a plane can fly (Institutional Design). We aren’t ignoring institutions; we are designing them to fight the specific forces we have identified.
The “Asset Price Collapse” Critique: “Forcing billionaires to pay 2% annually will force them to sell stocks, crashing the stock market.”
The “Ideology disguised as Mathematical Law” Critique: Entropy tools are descriptive, the choice to treat entropic (BG) equilibrium as “normatively attractive” is also a philosophical/policy move. We do not choose the entropy model because it is politically convenient (quite the opposite in this environment).We use it because it is empirically accurate. IRS data confirms that 97% of the population lives in a thermal (exponential) state. Acknowledging this reality is not ideology – it is the first step toward a more evidence-based economics. By targeting 0.50, we are simply trying to remove the artificial constraints (monopoly, rent-seeking, inheritance etc.) that are forcing the system away from a more neutral distributive state. The current inequality (Gini 0.83) is, to a large extent, the result of human interference and rigging the system; Gini 0.50 would be closer to the result of removing it.
The “Growth Critique”: Greater equality was not a cause of economic growth in the post WWII period but a function of a wide a range of unusual factors such as war rebuilding, demographics, technology, Bretton Woods order. While unique historical factors certainly helped, equality was one of the key transmission mechanisms that turned industrial capacity into sustained prosperity.
Without the high wages and social mobility of the era, the post-war technological boom would have collapsed before we reached a Golden Age. If the wealth generated by the post-war boom had remained concentrated in the top 1-3% (as it is today), the factories would have had few customers. High wages and unions redistributed corporate profits into the hands of workers, creating the Middle Class consumer who bought the cars, fridges, phones, TV’s, houses etc. The post-war era (low inequality) was uniquely free of major financial crises. In contrast, the post-1980s (high inequality) era has been plagued by bubbles and crashes(which confirm the unstable nature of the current distribution).
The “Natural Drift” Critique: Inequality is the natural drift of a free market? Why fight nature? We are not fighting nature; we are restoring it. We are advocating for a Single-Physics Economy. Currently, our economy is bifurcated. The bottom 97% live in a ‘Thermal’ state where income follows the Boltzmann-Gibbs distribution (Gini ~0.5). This is the natural, entropic signature of a fair, competitive market where money is exchanged for value. However, the top 3% operate in a ‘Super-Thermal’ state governed by Pareto dynamics, where capital multiplies exponentially through rent-seeking and compound interest, divorced from labour or value creation. We do not advocate for forced equality (Gini 0.0). ↩︎ - Beyond Money: The Multidimensional Poverty Index (MPI)
Poverty isn’t just about a lack of money; it’s a complex issue with many overlapping dimensions. Recognising this, the Multidimensional Poverty Index (MPI) offers a more comprehensive view by measuring deprivations across health, education, and living standards.
As a United Nations discussion paper notes, “As people who are left behind are likely to include more than just the income-poor, countries implementing the pledge will need to go beyond single-factor metrics.” Poverty can manifest as a lack of education, poor health, or inadequate living conditions, even when income is above a certain threshold.
The MPI, featured prominently in the United Nations Development Programme (UNDP) 2024 report, identifies individuals and households experiencing multiple deprivations simultaneously. Instead of just one metric, it looks at a collection of indicators to build a more detailed picture of poverty, including:
– Health: Nutrition and child mortality.
– Education: Years of schooling and school attendance.
– Standard of Living: Access to cooking fuel, sanitation, drinking water, electricity, housing, and assets.
The 2024 UNDP report highlights a powerful and devastating connection: the incidence of poverty is highest in conflict-affected states. Furthermore, these countries exhibit higher levels of deprivation in every single indicator that the MPI measures, from nutrition to electricity access. Specific country data makes this link tragically clear. In 2019/2020, Liberia, a country that has experienced significant conflict, had an MPI value of 0.259. This means that over half its population (52.3%) was living in multidimensional poverty. In contrast, Kyrgyzstan in 2018, a nation not recently affected by major conflict, had an MPI value of just 0.001. The MPI provides a crucial, human-centered lens. ↩︎ - Theil and GE indices are excellent for decomposability, but they treat perfect equality as the reference state. In a thermodynamic/econophysical frame, that is not the relevant equilibrium: real market economies with random, fair exchange and no preferential rules tend toward a Boltzmann‑Gibbs (exponential) wealth distribution with moderate inequality, not perfect equality. The BG KLD index keeps the information‑theoretic structure of Theil/KL, but re‑anchors the baseline at a Boltzmann‑Gibbs equilibrium distribution. In other words, it measures how far a real‑world wealth distribution is from a plausible statistical equilibrium, rather than from an unattainable state of perfect equality. ↩︎


Leave a comment